Between early 2009 and now, the Office of the Actuaries at the Centers for Medicare & Medicaid Services has lowered its forecast of medical spending in 2016 by 1 percentage point of GDP. In dollar terms, this is $2,500 for a family of four.Conover argues that, yes, the Medicare actuaries did revise their spending projections downward. However, these downward projections have nothing to do with the Affordable Care Act. In fact, the actuaries project that health care spending is higher in a world with the ACA than it is in a world without the ACA. Here's Conover:
So according to the Medicare actuaries, not only is the ACA not a significant part of the reason health spending is slowing down in recent years, factoring in the ACA has resulted in even higher spending than was expected when the law was scored 3+ years ago.And Conover is right. Just pointing to a decrease in projected health care spending and saying, "That's all ACA, baby!" is wrong. But what's also wrong is pointing to the increase in health care spending attributable to the ACA and treating it with the same disdain that you would with past increases in health care spending. In other words: yes, because of the ACA, national health care spending will be higher. But, because of the ACA, more people will have the ability to spend money on health care; so what did you expect?
Omitting the fact that the main reason that the ACA will increase national health care spending because of increased access to health care is a big deal. And that's because one of the untold tragedies behind the statistic that the US spends more money per capita than any other developed nation in the world and still has worse outcomes is that we don't even spend that money on everybody. A large portion of the US population lacks meaningful access to health care. And the ACA helps to correct that; which is why any mention of the increase in national health care spending should be put in the context of increased access to health care.
One way to do that would be to normalize health care spending by dividing the number of dollars spent on health care by the number of insured Americans. This would have the effect of controlling for the increase in health care spending due to increased access. Of course, this method isn't perfect. You can still be uninsured and spend money on health care. However, I think that some of that imperfection can be mitigated by the fact that a large amount of the care provided to the uninsured is uncompensated care provided by hospitals. These costs are then generally passed on to the insured. Put another way: one could argue that health care costs are borne almost entirely by the insured and not by the general public (ignoring Medicare/Medicaid taxes, obviously) so that the effect of normalizing health care spending by the number of insured Americans is that you have a statistic that roughly shows the share of health care spending that an insured American is "responsible" for, i.e. the expected health care premium. Note: this number is much higher than the average premium people actually pay because this number includes Medicare and Medicaid spending.
After you account for the increase in the number of the insured as a result of the ACA, then the argument that the ACA will make the average family better off actually looks like a good argument. Here is a graph of my estimates of health care spending per insured American:
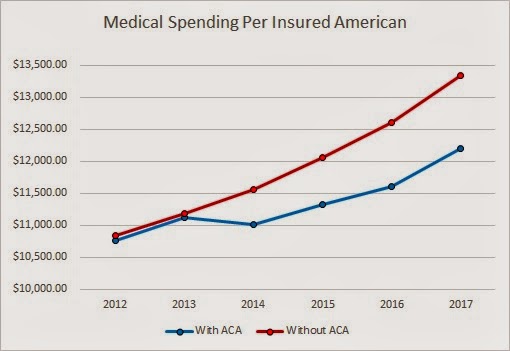
From 2014 to 2017 (inclusive), the difference between having the ACA and not having the ACA is $554, $723, $1001, and $1137 per insured American. So yes, total health care spending is higher, but the insurance base is broader and the costs are more spread out. On average and simply from a costs perspective, people who currently have insurance will be better off because of the ACA. Not to mention the currently uninsured who will be much better off. So while David Cutler's numbers may be wrong, his argument - that the average American family will be better off - isn't.
Caveat: it is possible that difference between the ACA spending and non-ACA spending can be fully explained by changes the ACA made to Medicare and that the average person will not see any of these savings in the form of insurance premiums. I think that this is unlikely. But even if it is the case, the average individual will still be made better off because of lower taxes and increased Medicare solvency.
Boring data attributions: The CBO provided insurance coverage projections. These projections were made before the Supreme Court ruling (meaning that they overestimated insurance coverage). These projections were used on purpose because CMS's health care expenditure projections were made before the Supreme Court ruling. I couldn't readily find non-elderly Medicare enrollment projections so I used the Census's population projections to suss out the differences.
Update: It's come to my attention that some people may disagree with the inclusion of Medicare and Medicaid spending and enrollment data. I disagree (you can view my comment to see some of my reasoning), but welcome arguments. However, I do agree that looking at private health spending in the context of private insurance coverage is useful. The following chart displays this ratio. Note: this data excludes Medicare, Medicaid, and CHIP enrollment and spending; however, it includes other government spending/enrollment such as Department of Defense and Veterans' Affairs enrollment and spending (mainly because finding the projections of these programs' spending and enrollment would take me a bit of time, although I imagine [but have not verified] that the ACA does not touch the DoD or VA).

The ACA still has the effect of spending less per insured than without the ACA (except for in 2013, which is probably a rounding error). From 2014 to 2017 (inclusive), the savings are a much more modest but still impressive $105.92, $271.40, $521.08, and $681.22 per insured American.
1. I'd encourage you to back out Medicaid and Medicare spending/enrollees, as this contaminates your trends considerably.
ReplyDelete2. The average uninsured person has total health expenditures that are about 60% those of equivalently situated people with coverage; my impression is that your estimates implicitly assume such people go from $0 to average spending levels, which isn't true.
3. You're too preoccupied with medical spending and seem to forget that the vast majority of newly covered are tax-subsidized. So even if everyone else saw a slight reduction in their premiums, this would be more than offset by higher taxes they'd face to cover this cost. The hard truth is that the average uninsured person got about $1000 annually in subsidized care. Under Obamacare, the average newly uninsured person will receive a subsidy that is several multiples of that amount. CBO reports very high costs per Medicaid eligible and the average exchange subsidy exceeds even that amount!
Thanks for the comment! I appreciate your reading and responding to my post.
Delete1. I think that Medicaid and Medicare spending/enrollees are important to add for several reasons: 1) Medicaid is the most cost-effective insurer in the US. If you were to try to increase coverage without driving up medical spending astronomically, then using Medicaid to cover a large portion of the population is a good strategy. Adding Medicaid spending/enrollee data helps to underline this point; 2) As you know, a large portion of the ACA is funded by savings from Medicare reforms. Including Medicare spending/enrollee data helps to underline the increased-coverage-modestly-increased-spending point; 3) Medicare and Medicaid are obviously huge players in the HC field and I think that not including the impact that they have on total spending and enrollment would be a mistake. However, I think you have a point in that a corollary metric, one that just looks at private-spending-to-enrollment-ratio would be useful and I will add one as an update to this post.
2) My implicit assumption is not that the average uninsured person doesn't spend money on health care. My implicit assumption is that the lion's share of spending by the uninsured is borne by the insured, either explicitly or implicitly. In this Health Affairs study (http://content.healthaffairs.org/content/27/5/w399.full) the authors estimate about $56 billion of uncompensated care vs. about $150 billion of uninsured health care spending in 2008 (the $150 billion, though, includes the entire spending of the part-time uninsured; most of the part-time uninsureds' spending occurs when they are insured).
3) I don't see this as that big of a problem. First, the insured are already paying for a good portion of the care of the uninsured. Second, I think the higher tax case is a bit overstated. The ACA is largely paid for by savings in Medicare and other federal health programs with $732 billion in savings vs. $520 billion in revenue (or ~$800 billion including penalties, depending on how you want to count it). Furthermore, the ACA taxes aren't exactly a tax on everybody and are largely contained within the HC system (with some of them existing for the purpose of offsetting new benefits, like the elimination of deductions for Medicare D subsidies). Looking at the key revenue-raising sections in John McDonough's book (I imagine the projections are a bit outdated but the point still stands) there is $435 billion in new tax revenue over 10 years. The one's that are "on people" account for ~60% of new revenue and mainly affect the wealthy ($210b on Medicare taxes for high-income, $32b on from "Cadillac tax", FSA limitations, tanning, etc.). The rest are from taxes and fees on the HC industry, with arguments on the ability of firms to pass on these taxes to consumers being spotty.
Also, you state: "CBO reports very high costs per Medicaid eligible and the average exchange subsidy exceeds even that amount!" Perhaps you're making arguments for more government-centric HCR? ;)
To summarize, my argument is that a spending-to-insured ratio is a useful statistic to put HC spending in the context of increased coverage. This statistic is especially powerful if my assumption that the uninsured impose costs on the insured stands. However, if my assumption does not stand, the statistic is still useful (admittedly, though, less so) as most people do view expanding HI coverage as a worthy goal in and of itself and that a spending-to-insured ratio would be used as a benchmark of cost effectiveness.
Thanks for the recalculations, but you still seemed to have missed the point. Obamacare was sold on the false promise that it would reduce national health spending AND cover many uninsured. Examine how the original $2500/family savings estimate was produced in the first place. Advisors predicted $200 billion reduction in national health spending, divided by population and multiplied by family of 4. It was POTUS who erroneously converted that number into a premium savings estimate.
ReplyDeleteLikewise, look at Cutler's most recent statement. He's saying total health spending has dropped by 1% of GDP and that translates into a savings of roughly $2500 per family. Again, this is DEAD WRONG. You appear to concede this point and then go on to do all sorts of manipulations of the data to show that he's really right after all. If you're really interested in knowing what happened to private premiums, look at KFF/HRET annual employer health benefits survey: total premiums for family coverage have increased by more than $2700 between 2009 and 2013. No one can seriously claim these premiums would have increased $5200 absent Obamacare.
Well, it appears as if we are talking past each other. Thank you for your opinions, though.
Delete