In 1983, Chairman Ben Bernanke (then a professor at Stanford) wrote a paper titled Nonmonetary Effects of the Financial Crisis in the Propagation of the Great Depression. Roughly translated into English, that would be: Why Banking Failures Made the Great Depression Last Longer.
Before Bernanke wrote this paper, most mainstream economists had reached a general consensus on how the financial crisis of 1929 started the Great Depression and how subsequent financial crises aggravated the Depression. In other words: economists knew how problems that started in the financial sector led to problems in the real economy. This understanding came mainly from the work of Milton Friedman and Anna Schwartz. In A Monetary History of the United States, Friedman and Schwartz argued that the main avenue by which financial crises during the Great Depression affected the real economy was by leading to a rapid drop in the money supply. A good allegory for how an insufficient supply of money leads to problems in the real economy is the baby-sitting coop story. Paul Krugman retells it here and it really is worth the quick read. However, if you're looking for a one-sentence summary: shortages of money dissuade people from trading with one another leading to a fall in economic activity.
Now, as nice as Friedman's and Schwartz's theory was, it was still incomplete. While it could explain the role played by bank failures in causing the initial severity of the Great Depression, it could not explain the role played by bank failures in causing the Depression's prolonged nature. Why? Because if you read any economics textbook, it will tell you that a change in the money supply can have short term effects on real economic activity; however, once the economy has had enough time to fully adjust its wages and prices, then you're back to the original level of economic activity. Given that the Great Depression lasted from 1929 until the beginning of World War II, it's pretty obvious that a fall in the money supply wasn't the whole story.
Enter: young Ben Bernanke.
Okay, maybe not this young.
Bernanke argued that the main service that the financial sector provides is the ability to discern "good" borrowers from "bad" borrowers (this isn't the innovative part of his paper; I'll denote that with a *). But the market for loans isn't a complete market. Whether or not a borrower is good or bad is information only known to the borrower (and sometimes not even known to the borrower him/herself). Sure, you could use various indicators such as credit scores to try to guess this, but it's still an imperfect method. Furthermore, borrowers aren't a homogenous group. Borrowers are, well, people. And it takes time to get to know people. But if there's one thing that banks have: it's time (money, also).
Banks gathered information on their customers that enhanced their ability to discern between good and bad borrowers. Maybe after a manufacturing firm paid back a loan to a bank, the bank may have learned that the manufacturing firm was a well-run business that was worthy of further loans. Or maybe after a farmer paid back a loan to a bank - even during a down year for crops - the bank learned that the farmer had the ability to weather down years and was also worthy of further loans. Unfortunately, this sort information is very hard to gather and it takes a lot of time. So whenever a bank failed, all the hard-won information that the bank had on its borrowers disappeared with the bank. The borrowers could try to get loans from other banks, but there was an economic depression and banks were very wary to lend money - especially to people they knew nothing about. The squeeze on credit that resulted from the financial crises directly translated to a fall in aggregate demand, prolonging the Depression*. Since it takes a long time to build new relationships between borrowers and lenders, this meant that the fall in economic activity would last for some time.
And this is partly why the Bernanke-led Fed worked so hard during the height of the financial crisis to stop solvent banks from failing and to get insolvent banks bought up by other banks. They didn't want the institutional knowledge of the failing banks to be lost because that would have meant a much longer period of economic depression. Unpopular? Yeah. But a guy who wins his state's spelling bee at the age of 11 probably wasn't going to win any popularity contests anyway.
Monta Ellis has been playing phenomenally. Granted: we're only 12 games into the season. Whether or not Montaball continues to be a noun that is associated with positive feelings remains to be seen. Given my description of Monta's play so far, this begs the question: if Monta is playing so well, then why the title "Monta Python and the Holy Fail"? Because: 1) I thought it was clever; and 2) Monta Ellis represents one of the current failures of basketball analytics: the ability to separate player from context.
This is a difficult problem. Basketball is not baseball. In both sports, a player's performance is affected by external variables. But in baseball, those external variables are easily quantifiable. Not so much in basketball. In basketball, we have to rely on imperfect proxies. An interesting example of this is shown in the below video in which Ben Alamar, a former analytics consultant for the Thunder, describes how he estimated Russel Westbrook's passing abilities. Westbrook's passing abilities were influenced by external factors such as: UCLA's shooting ability, UCLA's offensive scheme (Westbrook mainly played the 2), opposing team defensive schemes, etc. To control for this, Alamar simply looked at the probability of Westbrook's teammates making a shot. If this probability is significantly higher after receiving a pass from Westbrook, then this would suggest point guard-esque passing skills.
But back to Monta. Maybe the Dallas Mavericks' front office had advanced statistics that suggested that Monta is a more efficient player than his statistics say. However, those of us not in the front office did not have access to such numbers. All we could do was look at his stats and say that this is a guy who shoots four three-pointers a game even though he only shoots the three at a 28.7% clip. Of course, what was missing was the context. Bluntly put: Monta was expected to carry the offense of a team that didn't complement his skills well.
Which brings us to the two questions that this post is trying to answer: where is Monta's increased production coming from and is it sustainable? To answer these questions we will look at three Montas: 2007-08's Good Monta, 2012-13's Bad Monta, and 2013-14's So-Far-So-Good-But-Let's-Hope-He-Can-Keep-It-Going Monta. Emphasis will be placed on the latter two.
Where are Monta's points coming from? Here is a chart that breaks down his points per game by shot distance for the 2012-13 and 2013-14 seasons:
And a chart showing the difference in PPG by shot distance between the two seasons:
What these charts tell us is that of the seven distance categories, Ellis has increased his scoring output in five of them. These five categories account for a 6.03 PPG increase in scoring (partially offset by a 1.86 PPG decrease in scoring in the the other two categories). 62% of the 6.03 PPG increase comes from two areas: the 20-24 ft. shot and free throws. Of course, the increase from free throws is a good indicator of sustainability while the increase from the 20-24 ft. shot is a bad indicator of sustainability. However, don't overreact too much. If Ellis kept his PPG differential in all categories except for the 20-24 ft. shot, while his 20-24 ft. shot regressed back to last year's form, Ellis would still average 20.6 PPG versus his current 23.3 PPG. Which leads us back to the second question that we asked: is his increased production sustainable? To answer that, we're going to have to look at his field goal percentages.
Here is a chart that breaks down his field goal percentage by shot distance for the 2012-13 and 2013-14 seasons:
And a chart showing the difference in field goal percentage between the two seasons (note: difference is percentage point difference):
Monta's field goal percentage this year is 7.96 percentage points higher than last last year (49.5% vs. 41.6%). From 5-9 ft. Ellis is shooting 18.97 percentage points higher. From 10-14 ft. Ellis is shooting 9.54 percentage points higher. From 15-19 ft. Ellis is shooting 24.71 percentage points higher. From 20-24 ft. Ellis is shooting 11.4 percentage points higher. These four areas are likely candidates for regression and account for 3.78 PPG (over 60%) of the 6.03 PPG increase (once again, this 6.03 PPG increase is partially offset by a PPG decrease in two of the areas).
So has Monta illegally taken up camp at the tail-end of the normal distribution and should expect to be evicted by the sheriff soon? Or has the extra space created by Dirk really been all that was standing in-between Monta Ellis and having it all? Unfortunately, this brings us back to the failure of basketball analytics. We just don't have the ability (yet, hopefully) to quantify the difference that Dirk makes on his teammates' shooting percentages. We can, however, create proxies by looking at two natural experiments in the history of the Dallas Mavericks: the trading of Devin Harris to New Jersey and the signing of Jason Terry. I submit that the difference in field goal percentage between Dallas Mavericks Devin Harris and New Jersey Nets Devin Harris as well as the difference between Dallas Mavericks Jason Terry and Atlanta Hawks Jason Terry can give us an (very) imperfect approximation for how much production we should expect Monta Ellis to be able to sustain.
Here is a chart that shows Devin Harris's field goal percentage by shot distance:
Here is a chart that shows Jason Terry's field goal percentage by shot distance:
And a chart that shows Jason Terry's and Devin Harris's combined field goal percentage, weighted by shot attempts:
By using the difference in field goal percentage between Harris's and Terry's time in Dallas and Harris's and Terry's time in New Jersey and Atlanta, we can approximate how much we can expect a similar guard (e.g. Monta Ellis) to improve upon playing in a Mavericks' uniform next to Dirk. Unfortunately, it looks like Ellis is significantly overachieving. Here is a chart showing the increase in field goal percentages of Harris/Terry (weighted) and Ellis (note: this is percent difference and not percentage point difference):
Monta's increased efficiency in the 10-14 ft. range and the 20-14 ft. range is what you would expect. However, his increased efficiency in the 5-9 ft. range and 15-19 ft. range is off the charts (not literally, though). Even though the increase is much greater than expected, I think that this is mostly attributable to Ellis's terrible 2012-2013 season. Here is a chart comparing Ellis's 2012-2013 FG% with Harris's and Terry's pre/post-Maverick weighted FG%:
The percentages for 10-14 ft. and 20-24 ft. are similar. However, Ellis under-performs substantially in the 5-9 ft. range and 15-19 ft. range.
Where we are at right now is that we can argue that we should not expect Ellis to regress significantly in the 10-14 ft. range or the 20-24 ft. range. This gives us 2.4 PPG of the 3.78 PPG gross increase that we are trying to explain. So then what about the 5-9 ft. and 15-19 ft. range? This is where the 2007-08 season comes in - Monta's most efficient season. I'm sad to say: it doesn't look good. During the 2007-08 season, Monta shot 43.1% from the 5-9 ft. range and 42.4% from the 15-19 ft. range. If we expect Ellis to regress to those levels while maintaining his current efficiency everywhere else, then we can expect Ellis to score 22.1 PPG vs his current 23.3 PPG. Not bad.
But we can do better. If we assume that Monta's "true" non-Dallas field goal percentages are 43.1% and 42.4% from 5-9 feet and 15-19 feet (which is close to the Harris/Terry weighted non-Dallas 44.5% and 44.5% [not a typo - it's the same percent]) then we can assume that Monta can improve his FG% by the same magnitude as Harris/Terry. That is, we can expect Monta's FG% from 5-9 feet and 15-19 feet to regress from 50% and 60.6% to 44.6% and 47.7%. All else equal, this gives Ellis 22.44 PPG.
In summary: this is all imperfect and mostly bullshit. There are a ton of assumptions built into this estimate. It was a lot of work to get to the answer that most of our guts already gave us: expect Ellis to regress, but not by much. At least we can say that with a little more confidence, though.
Christopher Conover of the American Enterprise Institute is not buying the claim - from health economist and former Obama adviser David Cutler - that the Affordable Care Act will save the average family $2,500 in health care spending relative to the trend. Cutler wrote in the Washington Post:
Between early 2009 and now, the Office of the Actuaries at the Centers for Medicare & Medicaid Services has lowered its forecast of medical spending in 2016 by 1 percentage point of GDP. In dollar terms, this is $2,500 for a family of four.
Conover argues that, yes, the Medicare actuaries did revise their spending projections downward. However, these downward projections have nothing to do with the Affordable Care Act. In fact, the actuaries project that health care spending is higher in a world with the ACA than it is in a world without the ACA. Here's Conover:
So according to the Medicare actuaries, not only is the ACA not a significant part of the reason health spending is slowing down in recent years, factoring in the ACA has resulted in even higher spending than was expected when the law was scored 3+ years ago.
And Conover is right. Just pointing to a decrease in projected health care spending and saying, "That's all ACA, baby!" is wrong. But what's also wrong is pointing to the increase in health care spending attributable to the ACA and treating it with the same disdain that you would with past increases in health care spending. In other words: yes, because of the ACA, national health care spending will be higher. But, because of the ACA, more people will have the ability to spend money on health care; so what did you expect?
Omitting the fact that the main reason that the ACA will increase national health care spending because of increased access to health care is a big deal. And that's because one of the untold tragedies behind the statistic that the US spends more money per capita than any other developed nation in the world and still has worse outcomes is that we don't even spend that money on everybody. A large portion of the US population lacks meaningful access to health care. And the ACA helps to correct that; which is why any mention of the increase in national health care spending should be put in the context of increased access to health care.
One way to do that would be to normalize health care spending by dividing the number of dollars spent on health care by the number of insured Americans. This would have the effect of controlling for the increase in health care spending due to increased access. Of course, this method isn't perfect. You can still be uninsured and spend money on health care. However, I think that some of that imperfection can be mitigated by the fact that a large amount of the care provided to the uninsured is uncompensated care provided by hospitals. These costs are then generally passed on to the insured. Put another way: one could argue that health care costs are borne almost entirely by the insured and not by the general public (ignoring Medicare/Medicaid taxes, obviously) so that the effect of normalizing health care spending by the number of insured Americans is that you have a statistic that roughly shows the share of health care spending that an insured American is "responsible" for, i.e. the expected health care premium. Note: this number is much higher than the average premium people actually pay because this number includes Medicare and Medicaid spending.
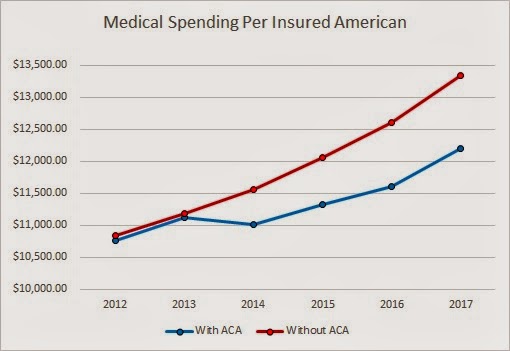
After you account for the increase in the number of the insured as a result of the ACA, then the argument that the ACA will make the average family better off actually looks like a good argument. Here is a graph of my estimates of health care spending per insured American:
From 2014 to 2017 (inclusive), the difference between having the ACA and not having the ACA is $554, $723, $1001, and $1137 per insured American. So yes, total health care spending is higher, but the insurance base is broader and the costs are more spread out. On average and simply from a costs perspective, people who currently have insurance will be better off because of the ACA. Not to mention the currently uninsured who will be much better off. So while David Cutler's numbers may be wrong, his argument - that the average American family will be better off - isn't.
Caveat: it is possible that difference between the ACA spending and non-ACA spending can be fully explained by changes the ACA made to Medicare and that the average person will not see any of these savings in the form of insurance premiums. I think that this is unlikely. But even if it is the case, the average individual will still be made better off because of lower taxes and increased Medicare solvency.
Boring data attributions: The CBO provided insurance coverage projections. These projections were made before the Supreme Court ruling (meaning that they overestimated insurance coverage). These projections were used on purpose because CMS's health care expenditure projections were made before the Supreme Court ruling. I couldn't readily find non-elderly Medicare enrollment projections so I used the Census's population projections to suss out the differences.
Update: It's come to my attention that some people may disagree with the inclusion of Medicare and Medicaid spending and enrollment data. I disagree (you can view my comment to see some of my reasoning), but welcome arguments. However, I do agree that looking at private health spending in the context of private insurance coverage is useful. The following chart displays this ratio. Note: this data excludes Medicare, Medicaid, and CHIP enrollment and spending; however, it includes other government spending/enrollment such as Department of Defense and Veterans' Affairs enrollment and spending (mainly because finding the projections of these programs' spending and enrollment would take me a bit of time, although I imagine [but have not verified] that the ACA does not touch the DoD or VA).
The ACA still has the effect of spending less per insured than without the ACA (except for in 2013, which is probably a rounding error). From 2014 to 2017 (inclusive), the savings are a much more modest but still impressive $105.92, $271.40, $521.08, and $681.22 per insured American.
Jody Shenn of Bloomberg recently reported that the private-equity firm Blackstone recently debuted bonds backed by rental properties. David Dayen thinks this is a terrible idea. Matthew Klein says, "what, me worry?"
Dayen is worried about the parallels between rental-backed securities and mortgage-backed securities. He writes:
You’ll remember that mortgage-backed securities were bestowed triple-A ratings during the housing bubble, and that this spurred massive purchases, fueling demand for more and more home loans to create more securities. You can see the same thing happening in the rental market if these securities catch on. In fact, while the most attractive foreclosed properties have already been snapped up, homebuilders are constructing new properties specifically for single-family rentals. Some analysts are concerned that this gold rush will create a new housing bubble in the communities where Wall Street firms are purchasing homes.
Klein disagrees and says:
Where Dayen goes wrong is assuming that these securities will help fuel another bubble and crisis, or breed “absentee slumlords.” The less exciting reality is that the rental market for single-family homes will probably remain a niche business that will be profitable for some people and make little difference to the rest of us.
Klein argues that the systemic risks of rental-backed securities are small because the size of the rental securitization market is small and is likely to remain small:
When the strategy first developed in 2011, investors could buy and renovate thousands of foreclosed homes on the cheap and rent them out for after-tax yields of as much as 8 percent. At the same time, they could position themselves to benefit from any rebound in housing prices. That made single-family houses attractive to investors hunting for returns of as much as 25 percent. But then places such as Phoenix became saturated with investor capital, house prices soared and yields fell. Investors moved on to Atlanta. As the housing market recovers, the opportunities for big gains will diminish.
Matthew Klein makes a good point here. The logic behind the housing bubble was that mortgage-backed securities remained profitable so long as housing prices continued to rise. The logic behind rental-backed securities seems to be the opposite: that rental-backed securities remain profitable so long as you can purchase rental properties while housing prices are depressed. Rising housing prices will, instead of reinforcing an asset bubble, serve as a check on any sort of bubble formation.
However, I'm not entirely convinced by Klein that rental-backed securities pose little threat. First, despite their AAA rating, these rental-backed securities are still quite risky - much more risky than mortgage-backed securities. Part of the logic that explained why mortgage-backed securities were less risky than individual mortgages was that the mortgages that made up the securities were geographically diverse. That's not the case with rental-backed securities. Blackstone's rental-backed securities are geographically concentrated. And they have to be to make property management feasible. One bad stroke of economic luck in the West could wipe out these securities.
Second, even though the size of the rental market is relatively small, it's possible that the market could gain disproportionate importance in the financial sector. Just as we saw during the MBS bubble, financial instruments such as synthetic CDOs and credit default swaps can magnify relatively small losses in the real economy. Furthermore, much of the money behind Blackstone's deal came from a 2 year loan with a floating rate. If the Fed overreacts to a future sign of inflationary pressure, it's possible that Blackstone could be hit with a double-whammy in the form of higher interest payments and lower revenue from rental properties. In need of liquidity, Blackstone would be forced into the tough situation of selling geographically concentrated properties in a higher interest rate environment. If the losses - possibly magnified by credit default swaps and synthetic assets - are large enough, there could be big trouble in the financial markets.
Not to say that this is likely, though. But it is possible. And it's unclear whether the advantages of rental-backed securities outweigh these risks. On one hand, there will be greater stability in the rental market of a city during a city-specific economic downturn. On the other hand, the rental and housing markets of one city can possibly be affected by the rental and housing markets of another, distant city. And in specific cities, firms like Blackstone could, as Dayen notes, gain a disproportionately large slice of market power. Which is why I would rate my level of concern with rental-backed securities as cautiously neutral to mildly pessimistic.
Private firms have given their estimates on the effects of the government shutdown on GDP. Macroeconomic Advisers says 0.2 percentage point. JP Morgan says 0.2 percentage point (no link). S&P says 0.6 percentage point. Goldman Sachs says 0.5 percentage point. Now, the President's Council of Economic Advisers is having their say and their whack at the pinata yielded a 0.25 percentage point loss in fourth quarter GDP (at an annualized rate, of course). This is more in line with the estimates of Macroeconomic Advisers and Goldman Sachs. However, the CEA goes one further than the private estimates and tacks a jobs number to their estimate: 120,000 less jobs created in the private sector for the first two weeks of October than otherwise would have been. Average the estimates out and you get a nice round 0.35 percentage point of lost annualized economic output in the fourth quarter.
But Jason Furman and the rest of the CEA are displeased with the private sector estimates (okay, they didn't actually say that). The CEA says that many of the private estimates of the shutdown's impact only took into account the direct loss of government spending and didn't take into account the broader effects of the economy - something that the Council of Economic Advisers did. How, you ask?
Well, every week the CEA releases their Weekly Economic Index. The WEI is created by the CEA by taking eight economic indicators and indexes, and performing what's called principal component analysis on them. This analysis captures a signal from the data that indicates which direction the economy is moving. The basic theory behind this is that the economy's movements have a predictable effect on certain indicators and that - since we can't directly observe the economy every week - we can estimate the weekly state of the economy from our observations of the indicators. After analyzing the indicators, the CEA normalizes that signal into one easy-to-digest number that corresponds with the annualized GDP growth rate. For example, if you have a WEI of 3.2, then if the economy grew at that week's pace for a whole quarter then you'd have a GDP growth rate of 3.2% for that quarter.
So which 8 indicators does CEA use? The CEA follows two consumer spending indicators: ICSC's Same-Store Retail Sales and Redbook's Same-Store Retail Sales; two consumer confidence indicators: Gallup's Economic Confidence poll and Rasmussen's Consumer Index; two labor market indicators: Gallup's Job Creation Index and the Department of Labor's Initial Claims numbers; one industrial production indicator: the American Iron and Steel Institute's Raw Steel Production numbers; and one housing market indicator: the Mortgage Bankers Association's Mortgage Purchase Applications numbers.
Now, of course, these data are noisy. And the CEA warns against putting too much stock into one Weekly Economic Index number. All the WEI can do is give you an estimate of the state of the economy that week. One week may be good because it's the week of a holiday. Another week may be bad because the Heat won the championship and everybody is in a foul mood. But, when a large event occurs in the economy (a government shutdown in tandem with the threat of default, say), then you can make a reasonable assumption that the change in growth rates between two weeks is largely due to that event. And the CEA did just that. They saw that the week before the shutdown the economy was growing at a 3.6% clip. At the end of the first half of October, they saw that the economy was only growing at 2.0% clip - a loss of 1.6 percentage points of growth. Since the numbers are reported in a format of quarterly annualized GDP growth, they multiplied the weekly number by 2 (the shutdown lasted two weeks) and divided it by 13 (the number of weeks in the quarter). And that's how they priced the GOP's derp at 0.25 points of GDP growth.
Here's an informative post by Simon Wren-Lewis on the difficulties that EU technocrats are having with calculating structural deficits. Essentially, Eurozone governments have to have their budgets approved by the European Commission. In order to be green-lighted for approval, the budgets have to meet some parameters related to the structural deficit. The problem? Structural deficits can be difficult to calculate in part because the natural rate of unemployment is hard to calculate. And it looks like the Commission is overestimating the natural rate of unemployment, forcing governments to run smaller deficits in a time when you really don't want to run smaller deficits.
Anyway, just something to note whenever chin-strokers propose technocratic solutions.
When doing research for my post on the infrastructure bank, I was surprised to find that the Heritage Foundation was against said bank. Conservatives generally approve of public-private partnerships. For example, former Senator Chuck Hagel co-wrote a bill trying to establish an infrastructure bank. Former Indiana Governor Mitch Daniels has been a vocal supporter of PPPs. And former Senator Kay Bailey Hutchison (I never thought that I'd miss her as much as I do) also co-wrote a bill trying to establish an infrastructure bank. So then, why is Heritage against the infrastructure bank?
Well, in their own words:
Problems abound with all of these proposals, particularly regarding transportation policy. First, they reinforce a Washington-centric view. States and regions know their transportation priorities and how to execute projects better than the federal government. Concentrating the decision making in Washington would sidestep the role of state governments and expand an already bloated federal bureaucracy.
I find this argument troubling. The infrastructure bank is not a usurpation of state and local authority by the federal government. The federal government would work in tandem with state and local governments to identify projects that have clear value but lack funding. The infrastructure bank would provide initial funding for a project, and the state or local government would affirm their support for the project by throwing in their funding. The infrastructure bank proposals make clear that the federal government will not fund the entire project - let alone a significant portion of it. Furthermore, the value of the individual projects would be affirmed by the private sector's willingness to throw in their own funding.
However, the most troubling part of the Heritage Foundation's argument against an infrastructure bank is the lack of imagine that they show with regards to the necessity of the federal-style governing structure that America enjoys. There are many infrastructure projects that span across localities and states that provide clear benefit to each locality, each state, and the entire nation. Imagine if the Interstate Highway System were to have been built by the governing framework that Heritage prefers. It's unfathomable to think that each town, city, state, and rural land owner would have been able to successfully coordinate to the degree that the construction of the Interstate Highway System required. And guess what: until the federal government stepped in, we didn't have such a system.
Matt Yglesias has an interesting piece that profiles an scam investment opportunity in which fans can invest in shares of their favorite players. It works like this:
This is structured as a stock offering but it's actually more like a loan. Imagine some billionaire loaned Arian Foster $10 million and in exchange Foster promised to pay the billionaire 20 percent of his future earnings. The idea basically is to securitize that $10 million, so that tens or hundreds of thousands of small investors can each own a piece of it.
Why would fans do such a thing? For the same reason that fans buy jerseys, tickets, posters, etc.: they feel an emotional attachment to teams and players, and express this attachment in the form of purchases that solidify their identity as a fan of a team/player. The key bet that Foster and the billionaire making the loan are making is that fans are willing to pay higher-than-market value for the privilege to own stock in Foster.
Which brings me to an idea in an investment company that I've had for a while. My hometown of Austin, TX has a very strong culture of supporting local businesses. Generally, Austinites express this identity by buying tacos at Torchy's, burgers at P. Terry's, and washing 'em down with a nice cold pint of Fireman's #4. However, I imagine that Austinites would love to support their local businesses not just by consuming, but also by investing. And here enters my idea: Keep Austin Weird Bonds.
I'd bet that Austinites would be willing to loan money at below-market value for the privilege of owning a stake in the local businesses that they cherish. The support-local-business identity would be further reinforced with stickers that local businesses that received funding would have to put on their storefront; something similar to the National Recovery Administration's Blue Eagle.
The New York Times has an article on the medical device tax, and it's truly worth a read. In my previous post about the tax, I cut the medical device industry some slack and said that they may have a case built around the concept of double taxation: that because hospitals have committed themselves to lowering their prices as a result of the ACA, the medical device industry will already feel pressure to lower their prices and a tax on top of that would be a double blow. Surprise! The industry lobbyists were being disingenuous. From the article:
The medical-device industry faces virtually no price competition. Because of confidentiality agreements that manufacturers require hospitals to sign, the prices of the devices are cloaked in secrecy. This lack of transparency impedes hospitals from sharing price information and thus knowing whether they are getting a good deal.
Even worse, manufacturers often maintain personal relationships (sometimes involving financial payments like consulting fees) with physicians who choose the medical devices that their hospitals purchase, creating a conflict of interest. Physicians often don’t even know the costs of the devices, and individual physicians often choose devices on their own, which weakens a hospital’s ability to bargain for volume discounts.
Such anticompetitive practices help generate a wide variation in the prices of medical devices — and contribute to higher prices in general.
It turns out that hospitals really don't have negotiating power when negotiating with the medical device industry. And the secretive nature of pricing may help explain why I could not find any industry estimates on the increased demand that is to be expected from 30 million possible new customers.
Here's Dean Baker with an easy mathematical example on why an industry that benefits from the ACA should help to fund the ACA:
To take a simple example, suppose a medical device company has a new screening device that it sells for $1 million. It cost $100,000 to manufacture, so it will make $900,000 from each device it sells. Before the ACA it had expected to sell 1000 copies of this screening device. That would gross it $1 billion, or $900 million in excess of its production costs.
As a result of the ACA more people will have access to health care and therefore demand for the screening device will increase. Suppose it were to rise by 10 percent. In this case the industry's revenue would rise to $1.1 billion and the profit over production costs will increase to $990 million.
Since the industry had not anticipated the ACA when it developed the screener, and had not expected these extra sales, this additional $90 million is pure gravy in the form of unanticipated profits. The logic of the tax is to take away this gravy to limit the windfall that device manufacturers enjoy as a result of the ACA.
Lawrence Summers argues in an op-ed piece in the Washington Post that since we can't agree on the debt variable in the debt-to-GDP ratio, we should focus on the GDP variable by trying to increase growth:
Spurring growth is an area where neither side of the political spectrum has a monopoly on good ideas. We need more public infrastructure investment, but we also need to reduce regulatory barriers that hold back private infrastructure. We need more investment in education but also increases in accountability for those who provide it. We need more investment in the basic science behind renewable energy technologies, but in the medium term we need to take advantage of the remarkable natural gas resources that have recently become available to the United States. We need to ensure that government has the tools to work effectively in the information age but also to ensure that public policy promotes entrepreneurship.
So what would the details of such an agreement look like? It's tough to say for sure, and there's a lot of moving parts; so I'm going to examine the proposal piece-by-piece, starting with public infrastructure:
Remember when the president proposed $50 billion in infrastructure spending? The Treasury does! Probably because they had to do a whole analysis of it. The most game-changing part of this proposal was the National Infrastructure Bank. How would it work? The White House explains here. Essentially, Congress would create the bank. The bank would identify projects that lacked funding and provided clear benefit to taxpayers (don't worry, the bank exists outside of Congress' appropriations process and the decisions would be made by a seven-member board - no more than four of whom could be from the same political party). Loans made by the bank for the projects would be matched by local government funding or by private investors. The project would generate revenues and provide a return on investment. The White House also provides a bonus fact in their explainer (which I find hilarious [the concept of the bonus fact, that is]): the AFL-CIO and the Chamber of Commerce both support the infrastructure bank. Unions get jobs. Big Business gets money. Governments save money. Everybody* wins! *everybody does not include investment banks that deal with state and municipal bonds
The Brookings Institution also has some infrastructure bank-related suggestions: the top suggestion being to establish the bank as an independent government-owned corporation outside of any government agency (note: this is not the same as a GSE). The main advantage of existing outside of an agency would be budgetary flexibility and the ability to fund different types of projects. For example: ideally, you would want the infrastructure bank to fund improvements to highways, airports, and railways, among other things. This would touch upon the bureaucratic turf of the FHA, FAA, and FRA (all located within the Department of Transportation) - not to mention the fact that telecommunication infrastructure investments wouldn't even be in the same department (if you're looking for telecommunications infrastructure, I would suggest your neighborhood-friendly Department of Commerce).
Brookings fills in more details about the bank here, and it's definitely worth a read if you're interested in minutiae of a legislative proposal that won't pass Congress for the foreseeable future.
Of course, all of this begs the question of how an infrastructure bank would affect growth. The Treasury analysis lists a lot of positive effects: demand-side, supply-side, and everything in-between (such as an increased feeling of national community). Regarding demand, Treasury points to the obvious fact of under-utilized resources (remember those construction workers that were building houses in Arizona before the housing bubble burst? Turns out they can build roads, too!) Also, less congestion means less money spent on gas which means higher consumer demand for other things. However, demand-side issues have usually proven pretty irrelevant to winning over the votes of Republicans, so let's focus on some supply-side benefits that Treasury laid out.
First, better public infrastructure means decreased shipment time and costs. This helps make American exports more competitive. Another bonus for Republicans: this disproportionately helps Middle America since they are geographically the farthest from a port. Second, transportation agglomeration increases property values. The White House points to an example of Dallas and its experience with DART. Third, transportation agglomeration also makes businesses more efficient. The White House points to businesses taking advantage of Chicago's position in the national transportation infrastructure. A more illicit example, however, may be drug dealers taking advantage of Chicago's position in the national transportation infrastructure. Lastly, more efficient transit solutions means more efficient workers. Or, if you're a Family Values Republican in the mold of Rick Santorum, less time spent in traffic means means more time spent at home with the family.
I'm going to close out with a quote of one part from a blog post by the Treasury Department that really brings to life what infrastructure improvements would look like (the whole post is worth a read):
When the Port of Seattle improves its connection with local freight railroads, it creates construction jobs for local workers – but the project’s benefits extend far across the heartland. By making it cheaper to transport cargo, this improvement will allow cattle ranchers in rural Montana to ship their beef to new markets across the world. Consumers who purchase imported goods and American businesses that are expanding their exports enjoy lower prices and improved access to new markets and goods.
Fitch put the US government's credit rating on notice, to which the collective response from just about everybody was: "meh." As far as these things go, ratings agencies really don't have any information that the rest of us don't have. Furthermore, Fitch stressed that this was not an economic problem or a problem with the government's finances, but was a political problem. Fitch's full statement can be read here.
One part of Fitch's outlook, though, did jump out at me (the bold is mine):
Fitch's medium-term fiscal projections imply federal and general government (which includes states and local governments) gross debt stabilising next year and over the remainder of the decade at around 72% and 104% of GDP, respectively. This is below the 80% and 110% thresholds that Fitch previously identified as being inconsistent with the U.S. retaining its 'AAA' status.
Not only does Fitch have a threshold for government debt, they have a threshold that is 10 percentage points less than the much maligned Rogoff-Reinhart tipping point. I don't have access to Fitch's rationale for this, and would be very curious to see why they picked 80%. I did a cursory search on the 80% threshold and could only find mention of a correlation between 80% debt-to-GDP and debt crises. And I don't think I'm alone in being completely flummoxed on the use of this number. When European Commissioner Olli Rehn cited 80% as a debt threshold, Brad Delong could not find any reason for why that number was used.
It's a bit disconcerting that ratings agencies are using numbers that were seemingly pulled out of thin air. Even if Fitch used the now-debunked 90% threshold, at least the rationale would have been clear.
Ezra Klein seems to be against the medical device tax - a 2.3% excise tax on medical devices that's supposed to help pay for the ACA. And sure, he's right about the fact that if you were designing optimal tax policy, the medical device tax would never enter the discussion. But, as the debt ceiling debate illustrates, we don't live in an optimal world. So, instead of comparing tax policy to the optimal, let's compare tax policy to the actual.
When writing the ACA, the House really wanted this to be a bill financed by taxes on the wealthy. However, the Senate wanted this to be a bill financed within the industry. This meant that a bill that aimed to expand health care coverage would be partially financed by the health care industry's stakeholders. The health insurance industry, hospitals, and others, would help partially pay for their increased business via taxes and fees. This included the medical device industry. And that makes sense; if you want to both expand coverage and contain costs, taxing and charging health care stakeholders for increased coverage achieves both of these goals while avoiding the economically strange outcome of redistributing resources from the wealthy to the health care industry. And thus was born the medical device tax.
Klein cites job losses and off-shoring as negative effects of the tax. In addition to these, the industry cites reduced R&D expenditures. However, the CBPP is not so convinced. Since the tax applies to both domestically-produced and imported devices, this tax will not increase the incentive to move production overseas. Additionally, cost-containment measures in the ACA may actually spur R&D spending for medical devices. Furthermore, the study that most people cite about increased job losses used economic models and demand elasticities that don't apply to the medical device industry. In other words, they were bogus.
The only plausible argument against the tax that I've seen is the argument of double taxation: that because hospitals agreed to cut costs and because Medicare is decreasing payments, both of which to help pay for the ACA, and because these cut costs and decreased payments will fall on the medical device industry, then the medical device industry will paying twice for increased business. But until the medical device industry releases a credible study on the effects of the ACA on the demand for their products as well as cuts in spending on their profit-margin, we simply won't know whether or not their argument has merit. My suspicion is that they did do a study and found that the ACA, including the taxes, was a net positive. But why release that study when you already stand a good chance of repealing a tax that negative affects you?
We know that recent budget cuts have depressed economic growth. Paul Krugman talks about the Macroeconomic Advisers' estimate on the costs that the House Republicans have inflicted on the US economy via fiscal policy: $700 billion of wasted economic output and an unemployment rate that is 1.4 percentage points higher than it otherwise would have been. But the cost of House Republicans is even higher than that.
Felix Salmon notes the damage that they have done to the financial markets:
Rather, the harm done would be a function of the way in which the Treasury market is the risk-free vaseline which greases the entire financial system. If Treasury payments can’t be trusted entirely, then not only do all risk instruments need to be repriced, but so does the most basic counterparty risk of all. The US government, in one form or another, is a counterparty to every single financial player in the world. Its payments have to be certain, or else the whole house of cards risks collapsing — starting with the multi-trillion-dollar interest-rate derivatives market, and moving rapidly from there.
I think that this is a subtle point that has been missed in the entire debt-ceiling/budget debate but deserves some echo: even in the unlikely event that Republicans recant all of their demands and agree to a clean debt ceiling hike, the mere fact that they even attempted to govern as a minority party via threat of default could increase borrowing costs forever for everybody.
Essentially, Republicans introduced risk into the one risk-free investment. And this one risk-free investment is used as a baseline to price all risky investments. And so, while we may not see it now (because of being up against the zero lower bound), it's entirely possible that in the future we could see a slight risk premium being charged to the US government that will increase the costs of borrowing for everybody else. In other words: priced into all investments is the assumption that Treasury payments are 100% certain; as long as this assumption is questioned in the minds of investors, then borrowing (for everybody) will cost more than it otherwise would have. So congratulations, Republicans! Not only have you stunted economic growth for the past couple of years, you have permanently stunted all future economic growth!
Chicago economist Casey Mulligan gives us some economic derp in the form of a prediction (prederption?) of a recession in 2014: "Don't be surprised if the second redistribution wave coincides with a recessionary double-dip." Yes, he used the qualifier of "don't be surprised if," but as far as econospeak is concerned, this is the English idiomatic equivalent of "bank on it." What's the cause of the recession? Obamacare, of course.
In his op-ed piece, Mulligan writes a lot of very strange sentences that I just don't get. I don't want to use this post to nit-pick the article, but here are a couple of selected head-scratchers: 1) "The president's health-insurance plan forces those who hire, work and produce to pay full price for health care, while creating generous discounts for practically everyone else;" 2) "This second redistributionist wave of the Obama era will follow a first wave of tax hikes, additional unemployment benefits, food-stamp expansions, waived work requirements for welfare benefits, etc. These measures were supposed to be temporary, intended to help people cope with the recession. The recession officially ended in mid-2009, but many of the administration's measures continue."
1) Apparently, Mulligan is unaware that: 1) it is possible to both have a job and not have health insurance; and 2) health insurance benefits are actually discounted due to the fact that they're nontaxable (in fact, those without health insurance are actually paying for the nontaxable discount that those with health insurance receive [I'm also assuming that by health care, Mulligan really means health insurance]).
2) Either Mulligan is applauding the administration's economic efforts, or he's being very disingenuous. I'm going to go with the latter. More could be said, but this is an old line that has been refuted a bunch of times and just won't die.
But let's move away from the nitpicking and get to the real substance of the article. Why is Mulligan predicting a recession? Because the increase in the marginal tax rate caused by the Affordable Care Act will discourage working to such a degree that the labor supply will shrink to the point where US economic output will decline for at least two successive quarters. The marginal tax rate is calculated by combining both taxes and forgone benefits (such as a subsidy to help you buy health insurance).
Unfortunately, I was unable to access Mulligan's academic paper on this subject, so I don't know exactly how he calculated the marginal tax rate. However, I would imagine that since he uses a population-weighted average for his calculation, that this has the effect of creating an illusion of forgone government benefits for an individual. For example, one does not just choose to get unemployment benefits for 99 weeks. A fairly specific set of circumstances has to arise for that to happen.
But let's assume that Mulligan's calculations are correct. What does economic theory say will happen? Well, given that this is economics, we just don't know. Two effects could take hold: the income effect or the substitution effect. If the income effect takes hold, then workers will respond to their drop in income by working more (resulting in an increase in the labor supply). If the substitution effect takes hold, then workers will respond by substituting labor for leisure (resulting in a decrease in the labor supply). Mulligan seems to be banking on the latter. And he's not entirely wrong.
When the CBO studies the effects from changes in after-tax income on labor supply, they generally assume that the substitution effect is greater than the income effect. See here for a truly awesome explanation on their assumptions. Unfortunately, in their examples, they only look at the effects that explicit taxes have on labor supply; not implicit taxes in the form of forgone subsidies. Fortunately, they estimated the effects of the ACA on the supply of labor. Their conclusion? The amount of labor used in the economy will be reduced by 0.5 percent - primarily through the means of workers choosing to reduce their supply of labor. And that's not necessarily a bad thing. A lot of the decrease in the labor supply will be explained by people whom have the means to live without working but are forced to work because that is the only way that they can obtain health insurance. And it's a safe bet that population growth and labor productivity growth will more than make up for this decrease in labor supply, offsetting any possibility of a recession.
Near the end of his piece, Mulligan states that "advocates for the recent program expansions have failed to acknowledge that redistribution necessarily increases marginal tax rates and contracts the labor market." I don't think that this is the case. I think that advocates have acknowledged this fact. In fact, here's a paper where advocates do acknowledge that fact. We just put that fact in the context of other facts and conclude that it's really not that big of a deal - let alone recessionary.
The New York Times examined claims by Republicans that the Affordable Care Act is "job-killing" and is forcing many employers to convert full-time workers to part-time workers. Republicans point to the greater number of part-time jobs being created as their proof. However, as any economist will tell you (even Greg Mankiw!), this is pretty disingenuous as the trend in part-time job creation following this recession is right in line with the historical trend in part-time job creation following all of the other recessions.
Of course, in fairness to Republicans, the ACA does create a very large disincentive for firms with over 50 employees to have full-time workers in place of part-time workers. Whether or not this disincentive outweighs the benefits a firm gains from having full-time employees remains to be seen. My guess is that firms with over 50 employees that do not currently provide health insurance are concentrated in sectors that overwhelmingly rely on part-time employees anyway. If this is true, we really won't see a significant negative effect in full-time employment.
But let's imagine for a moment that we live in a world where the Republicans are right. In low-skill industries across the country, employers convert full-time employees to part-time employees. What happens? The immediate effect is that these firms then go out and hire more people to work the hours that their former full-time employees were working. Yes, the former full-time employees would be unhappy, but new part-time employees would be very happy. In this scenario, the ACA acts as an incentive for firms to enact a work-sharing program. Work-sharing has been used to great effect in Germany to keep unemployment lower and is actually one of the proposed solutions for unemployment from the American Enterprise Institute, a conservative think tank. This would also mesh well with one of the conservative arguments against raising the minimum wage: that the unemployed should not be discriminated against in favor of the employed.
There are other positive effects that the ACA could have on unemployment as well. Older workers that want to retire before 65 but don't do so out of fear of losing health insurance will be able to retire, opening up jobs to younger workers. People that keep jobs that they don't want because they want to keep their health insurance will leave their jobs, opening up jobs for other workers. Maybe they'll go work at a small business that they couldn't work at before due to lack of health insurance benefits. Or maybe they'll start their own company and create even more jobs.
But let's be realistic. The most probable case is that the number of large firms that currently do not provide health insurance and have a large number full-time employees is small; the number of people whom want to retire but can't because of lack of health insurance is small; the number of people whom want to quit their job but can't because of lack of health insurance is small. Overall, the ACA won't have a huge impact on employment. But if it does, it might be a better impact than Republicans think.
Miles Kimball has a good summary of the ways in which the characteristics of the health care market are not the characteristics of a classical free market system. When talking about how other countries reduce health care spending, Kimball reminds us that other countries
[u]se the fact that most of the money for health care runs through the government as leverage to push down the pay of doctors and other health care workers.
In other words, if we really want to control spending, doctors are going to have to be paid less. The New York Times Economix blog has an excellent piece by Catherine Rampell on doctor pay in the US and other developed countries. After accounting for difference in currency and cost of living, the US ranks 3rd in specialist pay and is an overwhelming number one in general practitioner pay.
Of course, as Rampell notes:
it’s important to keep in mind, the report notes, that health care professionals in other O.E.C.D. countries pay much less (if anything) for their medical educations than do their American counterparts.
Not to mention, doctors in other countries pay much less in malpractice insurance.
One of the reasons that doctors are paid so much in the US is that they are able to create their own demand. Every time a doctor orders a test or a procedure, that doctor is increasing his/her income. However, this is becoming less common as more and more doctors are forgoing private practice in favor of hospital employment. Unfortunately, this will not directly translate to lower health care costs as the result of this increased concentration in market share, leading to higher negotiated payments to hospitals - which brings me back to my earlier post regarding budget cuts at the Cleveland Clinic. If we're going to control costs, a lot of people are going to have to make less money.
The minimum wage debate has recently been in the news as Governor Brown signed into law a minimum wage increase in California and as - what seems like eons ago - President Obama proposed a minimum wage hike in the State of the Union address. Of course, the usual voices on the right have come out against increasing the minimum wage (or even having a minimum wage altogether). Kevin Hassett of the American Enterprise Institute, a conservative think tank, argued against the minimum wage here in what looks like a rewrite of his 2006 piece against increasing the minimum wage. The Heritage Foundation, another conservative think tank, had blog posts against increasing the minimum wage here, here, and here. There are many more posts and studies from the Heritage Foundation against the minimum wage if you're interested (apparently, they really hate the minimum wage). We also have University of Chicago economist John Cochrane here and Harvard economist Greg Mankiw here.
So what gives? Why are conservatives against the minimum wage? Anybody who has taken an Econ 101 class knows what the argument is: that a raise in the minimum wage is a raise in the cost of labor - and when costs rise, demand falls. The true minimum wage should not be determined by government fiat, but by labor's marginal productivity. If the government raises the cost of labor above labor's marginal productivity, then the result will be greater unemployment. This is the argument of classical economics. And it's available as a fun graph:
Now, as fun as this graph is, this fun does not compensate for the fact that this argument is outdated. Classical economics came of age during the middle of the Industrial Revolution. During the Industrial Revolution, many low-wage toilers toiled their days away in factories or mines producing products. When you are producing product it makes sense to talk about productivity as a determinant of labor's value (to be fair, the term productivity has taken on a more abstract meaning in economics beyond the production of goods, but the crux of the argument remains). If you owned a factory, you could produce more goods by hiring more and more workers and cramming them into your factory until the added productivity of an additional worker equaled the cost of that worker (the worker's wage). Now, this is of course assuming that somebody is willing and able to buy all the crap that you're producing (who needs a minimum wage law when you have Say's law!).
But low-wage workers in America don't really work in factories or mines anymore. They overwhelmingly work in service-sector industries such as retail or food service. In these industries, adding more workers to your store does not add to your overall production - it just adds to the number of people standing there looking at each other when there are no customers. If you own a store, you're only going to hire as many workers as it takes to man the shop, and this number is determined largely by customer demand - not by a capital-intensive conception of the marginal productivity of labor. This is why we are currently seeing stories about Amazon and Walmart hiring a ton of seasonal workers in order to prepare for the increased demand that comes with the holiday season. In this kind of economy, the demand for labor in the fun graph wouldn't be at a 45 degree angle; it would be nearly vertical. Raising the minimum wage would not increase unemployment, because a good retail company would already be running stores with the minimum amount of workers needed.
Of course, a minimum wage hike won't occur in a vacuum. The increased cost of labor will have to get absorbed somewhere. Jared Bernstein has a good piece that examines some studies that aim to find out just where the increased wages are absorbed. The two most plausible avenues are lower profit margins for employers and increased prices. Prices won't rise too much, though, as labor costs account for only a portion of a firm's overall costs. So if you're looking for a way to steer record-high corporate profits into the pockets of workers, a minimum wage hike is the way to go.
Just to be clear: I am not advocating a minimum wage of $100 an hour (conservatives sure do enjoy their slippery slope arguments). It is possible to raise the minimum wage to a point where running a retail establishment or fast food restaurant would be unprofitable, leading many firms to exit these sectors. However, I highly doubt that the line from profitability to unprofitably will be crossed because of an extra $1.75 per hour.
Also, here's David Cross talking about the minimum wage:
Justin Wolfers has a good piece in Bloomberg reminding us that the Fed is going to be undershooting its inflation target (by its own estimation) for at least three more years. But don't worry about deflation just yet. Looking at the Federal Reserve's projections, the bottom of the range of their projections for inflation is 1% - and this was revised up from June's lowest projection 0.8%, suggesting that inflationary pressures are (barely) increasing instead of decreasing. But, moreover, our lived economic experience suggests that wage and price stickiness is a real thing. Paul Krugman deals with this a bit here. In his post, he notes a Brookings paper titled "the Macroeconomics of Low Inflation." I think that this paper deserves a more in-depth look.
In this paper, the authors do several things. First, they argue that the reluctance of firms to cut nominal wages and the reluctance of workers to accept cuts to nominal wages is a real phenomenon and has been empirically observed. By reviewing various BLS data, Akerlof and co. found that during the 60's, 70's, and 80's, wage cuts were very rare. Even during the severe recession of 1981-82, wage freezes were much more common than wage cuts.
Second, they argue that previous studies that show that wages don't show downward nominal rigidity (that wages can be cut and often are) were prone to reporting error - survey respondents would report wage cuts that didn't actually happen.
Third, they create two models - one that incorporates wages that aren't cut easily (sticky wages) and one that incorporates wages that can be cut easily (flexible wages) - and run them following the shocks of the Great Depression. While the model with flexible wages predicted massive deflation that never actually happened, the model with sticky wages tracked the actual inflation path of the US economy fairly well.
So what are the real world policy implications of wages that just refuse to be cut? The biggest implication is that we live in a world where the employment market can only adjust wages upward. If the employment market needs to adjust wages downward, then it's going to have no choice but to hold nominal wages steady and wait for inflation to bring real wages down to where they need to be. This could take quite some time if you're only getting inflation at 1% as we are now. A corollary to this is that an economy with complete price stability (zero inflation) will have no mechanism to adjust wages downward leading to a much more inefficient economy with a significantly higher level of unemployment.
If nominal wage rigidity causes such problems, can't we just get rid of it? This seems to be the radical conservative economic plan. By getting rid of unions, minimum wage laws, and other statutory reinforcements of nominal wage rigidity, wages will finally be free to adjust downwards and we can live in a utopia of stable prices and fully flexible wages. However, as much trouble as sticky wages cause, they save us from a much bigger problem: mass debt defaults. Your wages may be cut, but your mortgage payments stay the same. By preventing mass debt defaults, sticky wages serve as an important safeguard against greater damage to the financial system during times of high economic stress.
There are many scare stories coming out about how the Affordable Care Act is forcing health care providers to cut budgets (notably, the Cleveland Clinic). The Atlantic did an admirable job in setting the record straight about these budget cuts by (shock) actually talking to the Cleveland Clinic. A notable quote from the article:
Actually, much of what the Cleveland Clinic system is doing follows the recommendations of health-care analysts closely. For example, it has consolidated closely located neonatal intensive care units, because high volumes tend to lead to better results. It's working to reduce the number of procedures its staff performs, since in the current system "physicians are rewarded to do more, not to do the right thing for the patient," as Sheil put it. And there's a new focus on chronic diseases, which are an increasingly important and costly area for treatment.
Note: all of these changes mean less revenue for the Cleveland Clinic. Or, in other words, less money is being spent in health care than otherwise would have been. This is what bending the cost curve looks like.
When we talk about bending the cost curve in health care, we usually speak in unoffensive terms: stopping duplicative procedures, cutting administrative spending, and replacing brand name drugs with generic drugs. But the first two terms mean less revenue for health care providers (something that the Cleveland Clinic is preparing for in these stories) and the third term just isn't as significant as we'd like it to be. Here's a useful graphic from the CMS:
As you can see, prescription drug spending and private health administration costs (the two most unpopular forms of spending) are just not that significant in the grand scheme of things. What is significant is spending on hospitals and spending on physicians. Thus, if we're actually going to slow health care spending, it is going to be through the means of politically unpopular cuts to hospitals and physicians. This is what bending the cost curve looks like.
William Pesek argues in an opinion piece in Bloomberg that deflation in Japan is - contrary to popular belief among most economists - actually a good thing. Pesek's reasoning is that Japan's population is disproportionately composed of elderly pensioners living off of fixed income whom would benefit from falling prices. Furthermore, as prices in Japan rose too high during the 1980's, deflation "has acted like a stealth tax cut for households and restored some sobriety to costs." Lastly, the Japanese government has amassed mountains of debt, and deflation - "which lowers nominal bond yields" - "makes that burden easier to service."
This piece is a bit of a ridiculous #slatepitch. Deflation is not good. Deflation is very bad - and most every economist knows this. It is generally agreed upon by both conservative and liberal economists that deflation is one of the main culprits behind the severity of the Great Depression. This is because deflation reduced earnings and increased real debt burdens, leading to mass-scale defaults. We see the same forces at play in Japan (the depressed earnings - not the mass-scale defaults). The following graph shows private sector earnings in blue and the CPI in red. Falling earnings track pretty well with falling prices.
In other words: deflation does not occur in a vacuum - my falling costs are your falling earnings and vice versa.
But how does this affect elderly pensioners? 1) Falling earnings put pressure on private pension systems. If earnings are not sufficient enough to fully fund pensions, then pensions may need to cut their benefits; 2) Falling earnings put pressure on public pension systems. Falling earnings mean depressed tax revenue. If public funds can not sufficiently fund the pension system, then benefits may need to be cut; 3) Falling earnings mean falling stock prices. This reduces the wealth of stock holders (a group that contains a not insignificant number of pensioners). All of these negative effects will be especially felt by near-future and future pensioners.
The worst part of the article, however, is the claim that deflation makes the government's debt easier to service via lower nominal interest rates. Low nominal interest rates (and deflation) are generally a sign of an anemic economy which translates to lower tax revenue. Lower tax revenue means that the government will have a tougher time paying off debt. Furthermore, deflation not only does not ease the burden of debt, it actively increases the burden of debt by increasing the debt's real value.
But let's assume I'm wrong about all of this (which I'm not) and deflation really is a boon to elderly pensioners. Do you really want to use the well-being of pensioners (25% of the population now, projected 40% in 2060) as your benchmark of success for a national economy?